Cash Balance Contributions: Definitely Not "Money for Nothing"
In our last installment, we took a look at the different ways to define the contribution credits in a cash balance plan. For Robert Smith, the owner and only employee of Robert Smith, Inc., the contribution credit is set at $100,000 or 66.67% of W-2 pay, if lower.
Now it’s time to start learning about the actual contribution amounts. As a refresher, the cash balance hypothetical account is equal to the sum of the contribution credits and interest credits. We include a brief introduction to interest credits below and will expand on them more in a later installment of The Corner. For now, we will focus on how the contribution and interest credits are used to determine the actual contribution amount the plan sponsor must deposit.
Setting the Stage
A cash balance plan provides a benefit equal to a hypothetical account balance to be paid to a participant at either termination of employment or termination of the plan. That hypothetical account balance is equal to the sum of all the contribution credits and interest credits for all the years the individual was covered by the plan.
Interest credits can be either a fixed percentage, based on a benchmark (such as the 30-year Treasury rate), or based on actual investment results. Robert’s plan defines the interest credit as a fixed 3%, which is applied to the beginning of the year’s hypothetical account balance.
There are many good reasons to use a fixed interest credit of, say, 3% versus benchmarks and actual returns, but most of the reasons come into play when the plan has more than just one participant. Since Robert is presently the only owner and has no employees, we will defer those discussions for a later time and stick with our interest credit of 3% for now.
Contribution Amounts
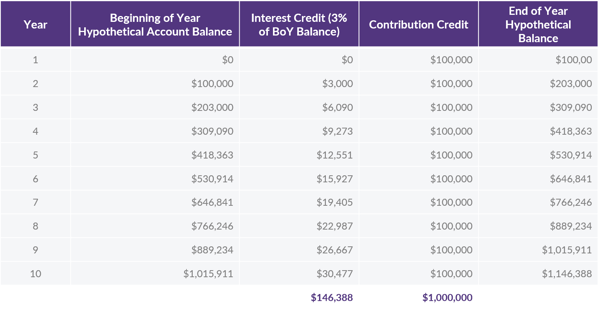
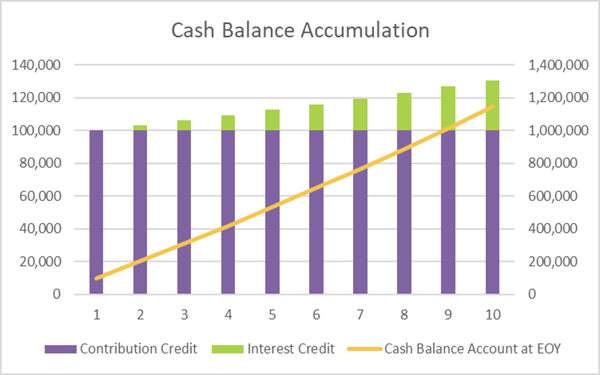
One advantage of adopting a cash balance plan instead of a traditional defined benefit plan is the predictability of the amount of assets needed at retirement. For example, we assume that Robert (age 52) starts a cash balance plan with a $100,000 per year contribution credit and plans to retire in 10 years. With the interest crediting rate fixed at 3% per year, his hypothetical account balance at age 62 will be $1,146,388 (comprised of $1 million in contribution credits + $146,388 in interest credits), as shown in the table below.

That means, his final lump sum amount (i.e. the amount the plan is required to pay out to him) will be $1,146,388 regardless of the actual return on assets.

If the actual investment return is exactly 3% every year (equal to the interest crediting rate), then Robert’s contribution will always be exactly equal to each year’s contribution credit of $100,000 to arrive at the $1.14 million needed at the end of year #10. Oh, how easy life would be if that always happened; but as we all know, it will not. If the actual return is, on average, less than 3%, then contributions will, on average, be more than $100,000 per year. If the average investment return is more than 3%, the average contribution will be less than $100,000 per year.
Excess assets are created by two sources – higher than expected investment earnings and contributions in excess of the earned benefits (prefunding). For example, if Robert contributes exactly $100,000 per year and has actual investment returns that exceed 3% per year, then the plan will be overfunded when he retires.
Keep in mind that it is bad if there are surplus that revert to the plan sponsor at plan termination – like 50% excise tax bad. It goes without saying that this scenario should always be avoided.
Since Robert did not design the plan to provide the absolute maximum benefit, he could amend the formula in this case to “absorb” the excess. With three-year-average plan compensation of $150,000 and a normal retirement date of age 62, his maximum lump sum is approximately $1.9 million. That means he has a “cushion” of approximately $750,000, so there is little chance there will be surplus assets when he retires and terminates the plan unless actual contributions and/or earnings vastly exceed $100,000 per year or 3%, respectively.
In most cases, business owners setup cash balance plans to increase the deductible contributions they can make, i.e. for tax deferral purposes. To mitigate the possibility of higher than expected investment returns (which result in a decrease in the required contribution amount), it is common to adopt a conservative investment policy designed to achieve the stated interest credit rate (3% in this case) as closely as possible.
Three is the Magic Number
DWC clients will see three different contribution amounts in the actuarial section of our Annual ERISA Compliance Review for cash balance plans:
- Minimum required,
- Recommended, and
- Maximum deductible.
Below is a quick summary of each contribution amount.
Minimum Required
The minimum required contribution is based on IRS rules that are put in place to make sure a defined benefit plan has adequate assets to pay benefits. One of the rules requires the use of discount rates that are, in most cases, higher than 3%. That results in a minimum required contribution that is less than the hypothetical account balances. This creates a nice cushion for a year when cash might be tight, but it is generally not a good idea to plan on only funding the minimum on a regular/ongoing basis.
Recommended
The recommended contribution is the amount that gets the plan assets equal to the liabilities (cash balance account). Assuming investment returns are exactly 3% in the above scenario, the benefit earned each year is $100,000, so the recommended contribution would also be $100,000. Stated another way, at the end of year 8 (for example), the recommended contribution would be the amount needed to increase the total assets to $889,234.
Maximum Deductible
The maximum deductible contribution allows for contributions that fund basically to 150% of the liabilities for past years plus the benefit to be earned in the current year. There are other factors that make up the maximum deductible amount, but for this example, we will keep it simple and just use the 150% factor in looking at the maximum deductible contribution for each of the first two years.

Conclusion
This is plenty to take in for one article. Over our next three articles, we will dive deeper into each of the three contribution amounts – the minimum, recommended and maximum.
Want a printable version of this article to take with you? Click here.


